| Brightness
/ Darkness and Contrast |
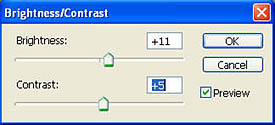
BRIGHTNESS/CONTRAST TOOL |
This adjustment is fairly self
explanatory. However there are several different ways to accomplish these adjustments. The most simple is the Darkness
to Brightness and Contrast
slider type adjustments that you find in most imaging programs. See an
example on
the left. Adjusting brightness and
contrast can also be done with a "levels" tool or a "curves" tool. These
two tools are found in most INTERMEDIATE level imaging programs. |
|
The levels tool or curves tool approach
to tonal range adjustment allows much more precise control over
the tonal range of your image. Tonal range within all digital images is
represented graphically by assigning 0 to black and 255 to white. The
equivalent of middle gray is
represented at about 128. The tools discussed below are very powerful and
I've only outlined some of their very basic capabilities.
|
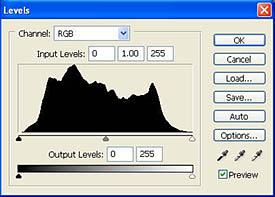
LEVELS TOOL |
With a levels tool you can adjust the dark
tones, medium tones and light areas of the image separately. In the
example on the left the dark graph area represents the distribution of
tonal range of the pixels in your digital image. This type of graph is
called a Histogram. Higher peaks represent a lot of pixels in that
particular numerical tonal range. low peaks or no dark graph area within
the graph window means few to no pixels are in that tonal range (0 - 255).
The small triangle at the bottom left of the graph is the "black point"
adjustment for dark tones. The gray triangle in the bottom center of the
graph is the "midpoint" adjustment for midtone areas of your
image and the white triangle at the bottom right of the graph is the
"white point" or highlight adjustment slider. Moving these sliders
"remaps" the existing pixel values in your image to the
numerical value represented by the new position of the slider after the
adjustment. |
|
This particular histogram represents a fairly
well balanced tonal range. Adjust white and black point first and mid point
last because adjusting the white and black slider automatically resets the
mid point slider to equalize your new tonal range. As an example of a levels
adjustment, if this image was from a very dark photo, the histogram graph
would be bunched up to the left with few if any pixels above 128. We could
move the white point slider over to the beginning of the actual graph and
expand the tonal range to contain a full range of tonal values from 0 - 255.
See a detailed article on
Interpreting RGB Histograms.
|
|
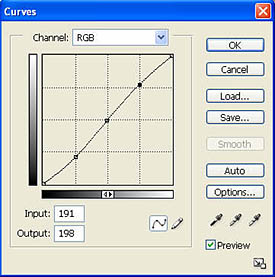
CURVES TOOL |
With a curves tool you can adjust any part
of the tonal range of your image separately. This is accomplished by
setting points on the graph line and "bending" the line by dragging these
points. The bottom left of the graph's line represents black or "0" and
the top right represents white or "255". The middle of the line is
the equivalent of middle gray at
"128". Setting a point in the middle of the graph and dragging that point
up will raise the midtones in your image while simultaneously and
automatically adjusting the tones below and above to blend with your new
midtone setting. In the example on the left I have set three points. I've
anchored the midtone area and set one point below midtone and one point
above midtone. I've raised the upper point to lighten high tone areas and
lowered the bottom point to darken the areas below midtones. This is a
standard method for increasing contrast in an image. |