A PRACTICAL GUIDE TO INTERPRETING RGB
HISTOGRAMS
By Steve Hoffmann
Learn how to interpret your digital camera's thumbnail image histogram to
help determine proper in camera exposure
Learn how to adjust tonal range in your scans or existing digital images
using the levels-histogram tool
HISTOGRAM AND RGB COLOR AND TONAL RANGE
EXPLANATION |
||||||
| This article was designed to be read from start to finish like a
tutorial.
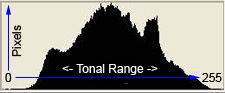
Digital image pixel tonality (darkness<>lightness) for 24 bit RGB color is expressed as a number between 0 and 255. 0 equals pure black and 255 equals pure white. The mid point at about 127 would be the equivalent of middle gray in density. Digital image histograms are presented as a bar chart with the horizontal axis being the tonal range of your image (see above example). The left side of the graph is 0 (zero) and the right side of the graph is 255. The vertical axis is the relative number of pixels at each of the 255 tonal values. The taller the hump in the graph, the more pixels reside at that particular tonal range. Sometimes the 'humps' in the graph may 'top out' on the roof of the graph. This only means that there are similar numbers of pixels for those adjacent tonal numbers or there is a disproportionately high number of pixels in that tonal area for the graph to show relative to the current scale of the graph. Some image editing program histograms also provide the mean and median average of the tonal level numbers for the image. Photoshop, Photoshop Elements and Paint shop Pro allow you to read the actual histogram. Place you cursor anywhere on the histogram graph and read the tonal number (between 0 and 255) for that area of the graph and the actual number of pixels in the image that are at that tonal number (or level). There is some fairly sophisticated math used to construct these graphs and I'm going to admit that I'm not a color scientist or math wizard. Another reason this article is called a 'practical guide'...:^) All of the different colors and shades of colors in RGB color are derived from varying combinations
of RED, GREEN and BLUE. The color of each pixel
in an RGB digital image is determined by the
tonal value (0-255) assigned to each color channel
RED, GREEN and
BLUE for each pixel. In other words every pixel has a numerical
tonal value assigned for each of the three color channels R,G and B. As
an example, a pixel's color numbers could be R255+G255+0B Those of
you familiar with a basic
color wheel
will remember that blue + green
makes CYAN and blue + red makes
MAGENTA and red + green makes
YELLOW. So the pixel color we described
above at R255+G255+0B would be pure yellow like this
Using the information in the preceding paragraph we can see that the
color and tonal range within an image is controlled by the pixels'
colors through their RGB 'numbers'. If we want a lighter yellow than the
one we have shown above we can raise the blue value from 0 to 175
and lighten the yellow to this
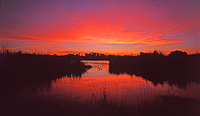
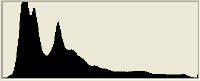
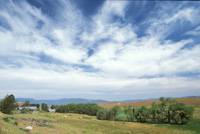
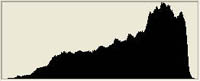
Histograms can be quite different looking depending the content of the image. That's why the title of this article is called "Interpreting" histograms. A histogram of a high key image with a majority of the content being very bright will produce a histogram that has most of the histogram graph located from the center to the right of center. A low key image with lots of dark and shadow areas will produce a histogram graph that is mostly center and left of center. There really isn't just one proper histogram for any given image. You can shift the tonal range (the histogram) around to lighten, darken or adjust the contrast in an image. To take advantage of the information supplied by an image's histogram you have to be able to visually interpret the image content, taking into consideration the location and approximate percentage of highlight, shadow and midtone pixels in the image itself. See two examples below |
||||||
|
||||||
|
Understanding histograms will help you make good decisions when adjusting the tonal range of a scan or an existing digital image. Once you have a basic understanding of how histograms are constructed you should be able to look at an image's histogram and figure out which parts of the graph correspond to the different tonal ranges and components in that image. The ability to interpret histograms is key to getting proper exposures with your digital camera. Trying to judge proper exposure by looking at a digital camera's small LCD playback/review of the image is very difficult because the lightness and darkness of the image on the LCD changes with very small differences in the viewing angle. This is why most mid to high end digital cameras offer the option of viewing a histogram along with the playback/review thumbnail image on the camera's LCD. In the next section we will discuss image tonality in more detail and explain the technical details of the histograms from 3 sample images. In the following sections of this article we will discuss tonal range adjustments using the 'levels' tool and methods for interpreting digital camera review/playback image histograms to insure proper 'in camera' exposure. |
||||||
|
||||||
|