INTERPRETING YOUR DIGITAL CAMERA'S THUMBNAIL IMAGE
AND HISTOGRAM |
| How well I remember my naiveté when I first got my Canon 10D. I knew
I'd miss the spot metering capability of my Canon 1V but I figured the
LCD image review would more than compensate for the loss of spot metering. So,
I shot about 100 images just looking at the image thumbnail on the LCD
to confirm exposure. After all, wasn't I looking at the actual final
image? OH BOY this is so easy. However, when I got home and downloaded
the images most of those first 100 images were underexposed and a few of
them were over exposed. That dang little LCD was next to useless as an
aid to judging proper exposure. It became obvious that I needed to
incorporate a little science into my DSLR picture taking workflow.
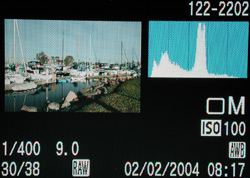
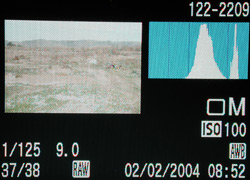
Thankfully, the 10D had an option to view an
image histogram along with the thumbnail review image. The histogram generated for
the images in the 10D is a luminance histogram.
Some DSLR's now offer a three channel RGB histogram option that actually shows a graph for each of the three colors, red, green and blue. A three channel histogram has the full range of values 0 to 255 for each color channel without the 'brightness compensation' of the luminance histogram. The three channel RGB histogram it is a more precise indicator of exposure since it will show you if you have clipping on any of the color channels on either end of the graph. Clipping (pixels at 0 or 255 level on any color channel) may lead to overexposed and blown out highlights or shadows that are nearly 'black'. If your camera has a three channel RGB histogram option, I recommend that you use that in favor of the luminance histogram option.
Digital cameras may use slightly different data to construct the 'in camera' histogram than your imaging program or RAW converter program. We have already discussed the difference between RGB and Luminance histograms. Here is another example. When you shoot RAW your camera's firmware has to set a white point, black point and midpoint to build the 'in camera' histogram for that image. RAW images, by definition, have no white or black point or midpoint setting until they are opened in your RAW converter. Most digital cameras build the 'in camera' histogram for RAW images based on the parameters you have set for JPEG image output even when you do not have the camera set to output JPEG. If you use your camera's supplied RAW converter, there should be no difference between the' in camera' histogram and RAW converter's default histogram. If you shoot RAW, and you use an aftermarket RAW converter, it might be beneficial to check a few 'in camera' histograms against the default histograms for those images in your RAW converter program and see if there if they are about about the same. Look to see if there is a repeatable difference with white point, black point and midpoint placement between the 'in camera' and raw converter program's histogram. If there are repeatable differences, you could take the difference into consideration when checking for proper exposure with your 'in camera' histogram. The bottom line is that the difference between RGB and Luminance histograms and small variations between 'in camera' and RAW converter program's histograms does not detract from the 'in camera' histogram's usefulness as a tool for judging proper exposure.
One
thing that became obvious after my first batch of images was that
shooting digital was much like shooting transparency film. You get much
more flexibility for post processing if you get
the exposure close to perfect 'in camera'. This is particularly important if your camera is set to output JPEG. Camera RAW format has more latitude for correcting exposure errors during post processing. Just like shooting transparency film with digital camera photography you have to watch out for
blown out high lights. Some photographers say that you get about 5-7 stops of
dynamic range in a high end DSLR. I believe the dynamic range available
in my Canon 10D and 1Ds Mark II is somewhere between 5 to 6 stops. I see some detail in shadows 2.5 stops under
exposure and
just a little texture in highlight areas at 2.5 stops over exposure. My
current picture taking workflow is to set my camera for 1/3 stop
increments in exposure adjustment (either shutter or aperture) shoot in
RAW mode and bracket any important shots, when I can, at + and - 1/3 stop.
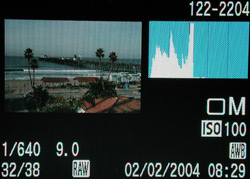
Below find three image example sets of 3
images each. Each image set was shot at the camera meter's choice for
proper exposure and then bracketed at +1 and -1 stop to more
fully illustrate the value of histograms and careful choice of exposure.
All exposures were made in manual center weighted mode with no exposure
compensation or interpretation of scene content. The images were shot in
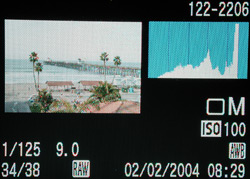
RAW mode. All of the thumbnails below the photo of the 10D's thumbnail
image and histogram were generated in
Capture One Pro using the
program's default color and exposure choices. The images were sized and
saved as high quality JPEG using Capture One DSLR Pro. The histogram
next to the Capture One DSLR generated image is Photoshop CS's RGB
histogram for that image. It was my intention to provide at least one image
with a dynamic range that would be hard to handle. We'll start with that
one. |
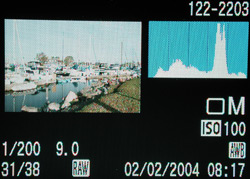
CAMERA'S CORRECT EXPOSURE |
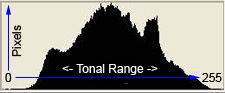
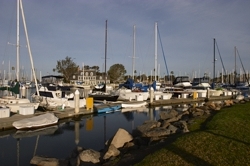
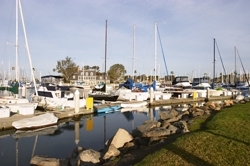
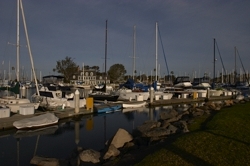
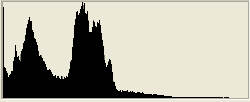
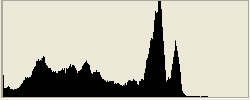
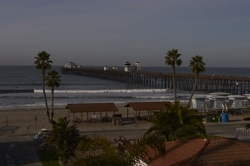
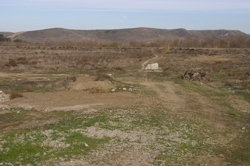
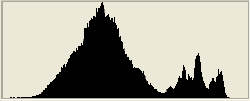
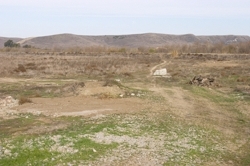
For this early morning contrasty image the sun was behind and
to my left. The tall spike is the sky area and the graph area to the
right of the spike represents the boats. The area to the left of the
spike represents the bay water and green grass and other darker
tones. The in camera
luminance histogram seems to indicate that we have fairly well
balanced exposure
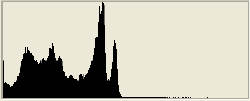
with our tonal range biased just a little on the dark side. However,
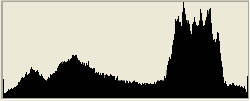
when we look at all the pixels in the RGB histogram below we find to
our chagrin that we have quite a few pixels with 0 color value on at
least one color channel. The in camera 'compensated brightness'
luminance histogram does not show us the entire 3 channel tonal
range. It looks like we may have benefited from just a little more
exposure. |
|
 |
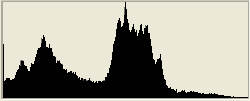
RGB Histogram |
We can do a levels adjustment to shift
the histogram but the pixels that originally were 0 or black on
all color channels, even if moved to RGB numbers of 10 to 40 on
all color channels,
will still not have any texture or detail. |
|
|
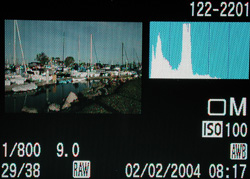
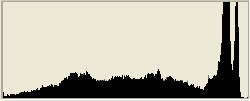
PLUS ONE STOP IN CAMERA |
Adding a full stop of exposure gets
rid of a bunch of those black pixels. The body of the in camera luminance
histogram looks to be nearly centered. However, we are now climbing up the right
side of the RGB histogram with a few too many pixels with white or 255 on at least one color channel. Some of
those boats may have gone pure white. Since the boats are an important
part of this composition, we don't want them blown out. Plus 1/2 to
2/3 stop more exposure from our camera's
original metering choice may have given the best exposure for
this scene. If I had paid attention to exactly centering the in
camera
luminance histogram, I would have nailed the exposure for this
particular image. In this case it would be better to have a few more
0 pixels than to have some of the boats blown out to pure white. |
|
 |
RGB Histogram |
|
|
|
MINUS ONE STOP IN CAMERA |
Minus one stop for this scene
doesn't give us what we want. The in camera luminance histogram
is shifted way over to the left. There are very few midtone or
highlight pixels in either the in camera luminance histogram or
Photoshop RGB histogram. This image would be difficult to fix
properly with a levels tool or any sort of tonal adjustment. We
could expand the tonal range and reset the output level for
our lowest number pixels up to 10 to 15 but we would still have
dull, detail-less lower midtones and shadows. Also, if we attempted to fix this image as
an 8 bit JPEG, the tonal range (histogram) would have had a lot
of blank tonal areas and spikes. A little more tonal information could
have been saved if we worked on this image in its original RAW
file (16 bit) state. |
|
 |
RGB Histogram |
|
|
|
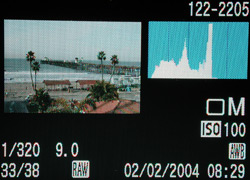
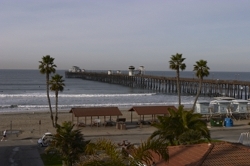
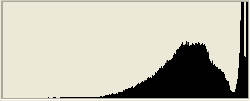
CAMERA'S CORRECT EXPOSURE |
It is pretty obvious that the camera's
selected metering is not going to cut it with this midday beach image. The
luminance histogram indicates that almost all of our tonality is
left of midtones. Looking at the image content we can see that
this should not be the case. This is a typical reaction for a camera meter
to a high key scene. The tallest spike in the RGB histogram is
the sky area and is just barely above midtone level. If we
visually divide the histogram into 5 equal sections left to
right, light midday skies should usually fall somewhere between the beginning
and middle of the last 20% of the graph. Looking at the RGB
histogram below even the second spike, which includes some of the white
surf, hovers around 175-185, not very 'white'. However, the tonal range of this
image could be expanded to look quite nice. We only have a few
pixels climbing up the left side of the histogram graph |
|
 |
RGB Histogram |
The right hand end of the small flat spur of highlights
just to the right of the second spike could be set close to
white and we'd be in the ballpark. |
|
|
PLUS ONE STOP IN CAMERA |
Plus one stop from the camera
meter's choice is pretty darned close. The in camera luminance
histogram is fairly well centered and the sky/highlight area
represented by the tall spike looks to be about in the right
place on the graph for a side lit pale blue sky. Looking at the
RGB histogram below we see the sky area represented by the
thicker spike to the right and the surf and highlight areas
represented by the thinner spike to the right are also about in
the right place. However we do have a few pixels in the 0 or
black area of the graph. One and 1/3
stop more exposure from the camera's
original metering choice would have got rid of the black pixels.
Doing this may have moved the sky, surf and highlight pixels a little
too far to the right. Did I say... ...BRACKET....:^) |
|
 |
RGB Histogram |
|
|
|
MINUS ONE STOP IN CAMERA |
One stop under the camera meter's
choice is way too dark. Again all of our pixels are below
midtone level. If this was your only image from this scene,
you'd be hard pressed to fix it properly. Are we seeing a trend
here? You bet! With contrasty scenes get as much exposure as is possible without
blowing out (pixels climbing up the RH side of the graph) the brightest area of your image that needs to hold
detail. Here is another approach for getting proper exposure.
If you can determine where your photograph's actual midtones are
located on the histogram graph, try to center them by adjusting
exposure until the midtone area of the photograph is located
close to the center of the histogram graph. |
|
 |
RGB Histogram |
If you can't determine which part
of the graph represents your midtones, adjust exposure until the
entire body of the histogram is fairly centered within the
histogram graph. |
|
Either of these approaches will generally get the exposure very
close to correct, if not spot on. |
|
|
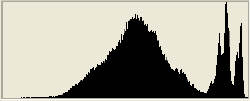
CAMERA'S CORRECT EXPOSURE |
Here's an example of an 'easy'
image. It is heavily biased toward midtones so the camera's
meter, which wants to read everything as a midtone, is pretty
accurate with its default setting. The luminance histogram is
fairly centered as we would expect in an image consisting mostly
of midtone content. The
second spike is obviously the sky area. In this case there are
no surprises with the RGB histogram. The more serrated area to
the right of the main hump in the RGB histogram represents the
sky and some
clouds we can barely see in either thumbnail image. We could add
just a little contrast to this image by setting new white and
black points with our levels tool. Since there are no real
black areas in this image, we would not move the black point slider
all the way to the start of the slope on the left side of the graph.
We would put the new black point just at or about half
way up to the short flat line of dark pixels on the left side of
the graph |
|
 |
RGB Histogram |
Same for the new white point.
About half way to the right hand start point of the graph would
do nicely for a new white point. |
|
We might want to fine tune the midtone slider depending on where
our midtones ended up after white and black point adjustment. Again, we'd want to do these
adjustments during RAW conversion or in 16 bit mode in
Photoshop. |
|
|
PLUS ONE STOP IN CAMERA |
One stop over for this image
shifts the tonal range a bit too far to the right. Most of the
midtones are now actually above midtone. Looking at the RGB
histogram below we see that the brightest sky areas are
approaching washout. Looking at the RGB histogram below we can
see the little tail end on the left side of the graph starts at
about tonal level 20. The darkest pixels in this image
start at 20 and there are very few pixels between 20 and 45.
This image would be improved by setting a new black point close
to the start of
the thin line of pixels on the left hand side
of the graph. This action would move the thin tail of the graph
closer to 0
and shift the midtone pixels down to a more natural looking
earth tone range |
|
 |
RGB Histogram |
|
|
|
PLUS 2 STOPS IN CAMERA |
I added this rendition at 2 stops
over to show a nice feature that many mid to high end digital
cameras have. Notice the little bit of speckle at the top of the
image. This is the camera letting me know that I have 'clipped'
those areas of this image out of color range and into
255R+255G+255B or pure white. This visual 'clipping'
notification is available on many mid to high end digital
cameras. Clipping notification usually takes the graphical form
of turning the clipped pixel areas to a blinking red or black in the review thumbnail. With some cameras this feature must be turned on in the
camera's features menu and with other cameras it is
automatically active when you are in histogram view mode. The
clipped area is represented by the last spike in the histogram
that is climbing the right hand side of the graph. Take another
photo, this one is not fixable... |
|
 |
RGB Histogram |
|
|
|
|
It takes a little practice to be able to identify which parts of the
histogram correlate to the different visual components and tonal range areas of
the image. It is a skill well worth learning and not too different from
the old black and white zone system. After a while you'll have an
intuitive feel for where sky tones, clouds, dark or light earth tones, and bright
highlights should fall in your image's histogram. You'll also
know how much a 1/3 or 1/2 stop increase in exposure will shift the
histogram to the right. Or, exactly how much a 1/3 or 1/2 stop decrease
in exposure will shift the histogram to the left.
Watching the endpoints of your histogram for stacking
and using the visual tonality of the thumbnail image to
determine where your midtones should fall is key to producing
properly exposed digital camera images.
Lastly, if your
camera has a spot meter and you are shooting a stationary subject, place
the spot on the very brightest light colored area of the scene that you want to hold
a little detail. Then set +2 stops of exposure from that
reading...and BRACKET + and - 1/2 or 1/3 stop. You'll have a winner
in that set somewhere, just check out those image
histograms...:^)
|
LINKS:
Histogram and RGB Tonal Range Explanation -
Page 1
Histogram and RGB Tonal Range Explanation -
Page 2
Digital Image Tonal Range Adjustment Using a Levels Tool
Web Site Links
|
|